2017年12月5日 星期二

K9K | System of Shape


System of Shape | Classification system for shapes


How to differentiate two shapes? Where is the difference between two shapes? While we are talking about a shape, we are talking about a specific shape, or the class of shape? When we say "triangle", we mean a specific triangle, or shapes with the features of triangle? How do we classify shapes? In what levels? With what features? Based on what features we are able to say "Hey! These two shapes are different" ? Do we have a system to classify shapes? I know we have a system to classify nature, but how about shapes? What if we want to classify shapes, what system we can use? Based on what criteria? Eyes? Maths? Anything else? Can we ask someone to draw a shape we want, for instance: "Please draw a shape, this shape has three lines, six vertices. Two lines are jointed together with a vertex and the other line has an intersection with one line and has another intersection with another line. One intersection is a T-like intersection and the other is a X-like intersection." Can she/he draws a shape for us based on this description?


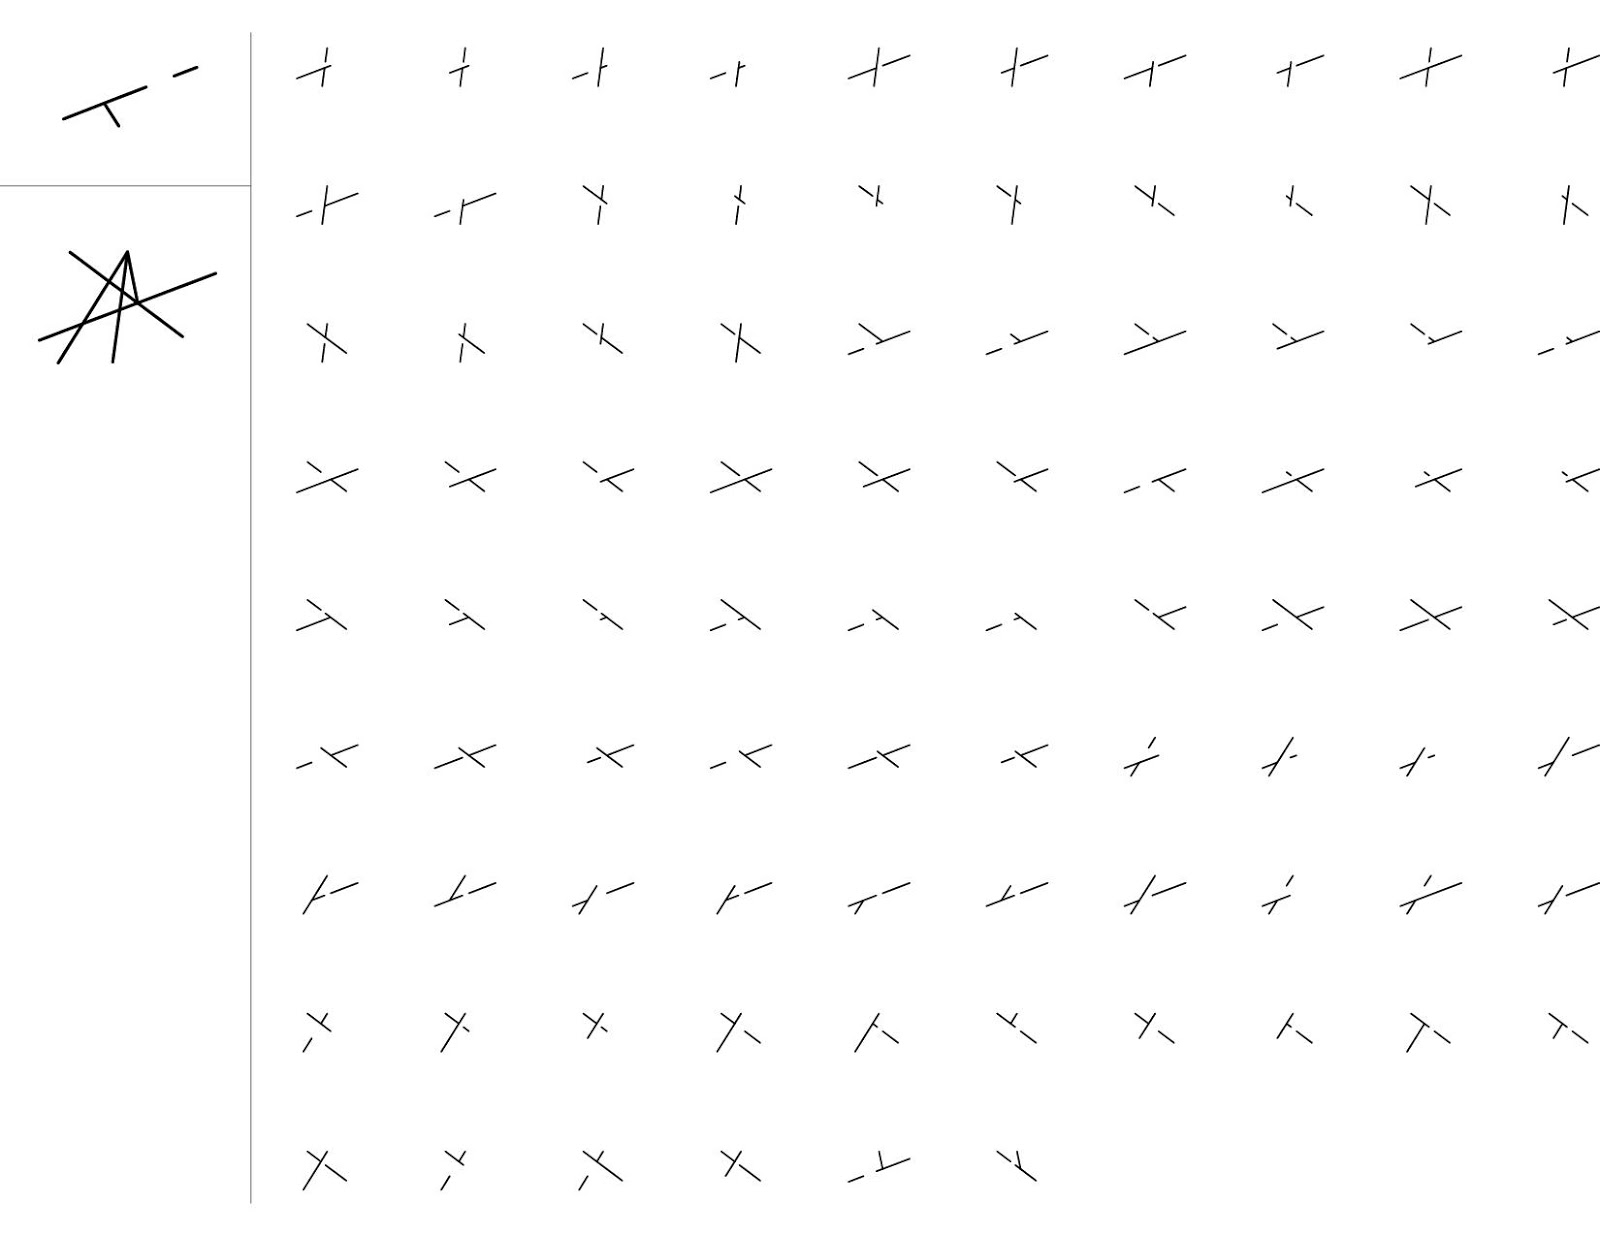
Here are two shapes we may think they are different. However, both shapes have three lines, an "L" and a floating line. Both shapes have three construction lines and these three construction lines have the same configuration. Briefly, they have the same structure (they are isomorphic) and they have the same underlying lines (construction lines). So, why they are different? The difference is the spatial relationship. The way the "L" and the floating line are arranged. Thus, here is a question: what kind of features we need to differentiate them or what information (data) we need? Good news is, we already found the features! Here are some examples:


Figure 01 - Differentiating the shapes with different spatial relationship


Another example we are interested in is "K" and "Ψ". These two shapes have the same structure (yes, they are isomorphic again) and they both have the same number of edges (lines), vertices including endpoints and intersections. The adjacency relationships among vertices are the same. So, again, why they are different? One more time, the simple answer is spatial relationship. We can view these two shapes as a composition with three lines with an arrangement that two "legs" connecting to one "spine". The difference is how these two legs are arranged. Are both legs in the same "side" like a "K"? Or, are these two legs are in different sides like a "Ψ"? What features we need to differentiate them? Or, how do we make the descriptions for these two shapes (to distinguish them)? Fortunately, we already found the features! Here are some tests:


Figure 02 - Differentiating "K" and "Ψ"

This kind of discussion can be also on "N" and "C". "N" and "C" are isomorphic, both shapes are a polygon with three line segments. Both shapes are a "continuous" polygon and the spatial difference is how these three segments are arranged. The features we used to differentiate "N" and "C" are the same as we used to differentiate "K" and "Ψ". Here are some tests:


Figure 03 - Differentiating "N" and "C"

Let's take a look at one more example: "Z" and "S". Again, these two shapes are isomorphic. Both shapes are continuous polygon with five line segments and the spatial relationship are very similar. But, in some level (what are the levels? we have other levels?), they are viewed as different shapes. So, the feature we used to differentiate these two shapes is the configuration of construction lines. Construction lines can be seen as the "guide lines" for the lines in a shape, we can say that construction lines are a part of spatial relationships. So, there are four intersections of construction lines in "Z" and six intersections of construction lines in "S". That's how we differentiate them. Here are some tests:


Figure 04 - Differentiating "Z" and "S"

For a long time, I thought dealing with an issue of shape recognition. It turns out I am dealing with an issue of shape classification, just like Carl Linnaeus did. "Recognition" is based on certain features which are already known, for example, when we show a frog picture to Google, Google will give me an answer: "Hey! This is a image of a frog!" But, if I show it an image of a creature which is just discovered (it is even without a name), then Google will say "Uh...it looks like a frog, but I don't know what kind of frog it is." However, if I put this creature into Carl Linnaeus's system, this system will give me a name, a new name. This is a question of classification, instead of a question of recognition. I spent a lot of time to figure out that I am actually working on a classification problem, not a recognition problem.


Let's go back to my research. If I draw a shape which is totally new, never exists before and never has a name, how we can name it? What features I should use to classify it? What kind of system I should follow? One more question: WHY DO I NEED TO NAME IT? My answer is simple:  ONCE WE NAME IT, WE CAN USE IT!


2017年11月30日 星期四

2017年9月5日 星期二

K9K | Searching 2 "K"s and put equivalent results in a group


Project Description |

Continuing the research of shape recognition, this test is to group found shapes which are symmetrically equivalent. Each column in the category presents the equivalent shapes. For example, the shapes in the first column, all the shapes are the rotations, reflections or diag-reflections of other shapes.
Fig.01 - 2 "K"s, page 1
Fig.01 - 2 "K"s, page 2

2017年8月23日 星期三

Expanding Sol Lewitt

Project Description |

This small project is inspired by Sol Lewitt, an American artist who introduced the complexity of geometry to art. One of his works, “no title, 1973”, reveals the possibilities of a simple geometry. This work is based on a square which contains 4 lines in it. Sol Lewitt simply shows all the configurations with these four lines: 1-line configuration, 2-line configuration, 3-line configuration and 4-line configuration. By manipulating the number of lines, he demonstrate how complex a simple geometry can be. Furthermore, this concept can be used in computational design to explore more potential of geometry. Sol Lewitt only reveals the complexity of line number changing, however, this geometry contain much more thing than we think. For instance, there are 28 configurations (or combinations) when the geometry is inquired for combinations of one T shape and one L shape shown as below.


No title, Sol Lewitt, 1973
T and L configurations in Sol Lewitt, T.C. Kurt Hong, 2017

Within these T-L configurations, it can be observed that each configuration can be a plan, section or elevation of a small house. In other words, this geometry actually provides us a large number of design candidates. This concept can also be seen in many architects’ plans. In Siza’s Museum of Contemporary Art Nadir Afonso shown as below, it can be observed there are some “underlying” geometries forming a geometry context. All the lines are part of this context. This context provides architect a source of design candidates. For instance, by removing some lines from geometry context, architects can create openings; by thickening some lines, architects can thus create walls; by trimming some lines, architects can thus create a interesting corner, etc. This geometry context is usually a combination of simple shapes such as rectangles, triangles, lines, squares just like the geometry that Sol Lewitt used. To explore more in Sol Lewitt’s geometry, we try different four-line configurations such as four-floating-line configurations, two-L configurations and other configurations shown as below.


Museum of Contemporary Art Nadir Afonso, Álvaro Siza, 2015
Two-L configurations in Sol Lewitt, page 1, T.C. Kurt Hong, 2017
Two-L configurations in Sol Lewitt, page 2, T.C. Kurt Hong, 2017

Two-L configurations in Sol Lewitt, page 3, T.C. Kurt Hong, 2017
Two-L configurations in Sol Lewitt, page 4, T.C. Kurt Hong, 2017

There are 46 results in four-locating-line configuration, and 258 results in two-L configuration. Each result can be used as a small plan to create space. In other words, this geometry can at least provide architects more than 300 Design candidates. The complexity of Sol Lewitt’s geometry actually can be much higher than 300 candidates if we ask for more configurations. Complexity is a critical element in design process. By introducing complexity, designers can thus create diversities to help them see more possible solutions, a mindful design category. Also, in Sol Lewitt’s works, the beauty of complexity is revealed.

Incomplete Open Cubes, Sol Lewitt, 1974

Another term for complexity in Sol Lewitt’s work may be “variation”. Producing variations is also a critical step in design process. Incomplete open cubes show us that variations can be created by simply removing lines from a cube, or simply selecting lines from a cube. Removing things or selecting thing are two of the ways to create “combinations”, like the operations in geometry context while designing architectures. To wrap up, this project is to propose a computational methodology to create complexity and diversity. With a simple geometry context, architects can have a highly diverse category for design. By adopting this method, the potential of geometry can thus be revealed.

2017年4月22日 星期六

ARGO | Construction Lines

Construction line | What do users mean when they draw this?

In the second semester at GT, we tried to generalize the shape recognition for more applications. Instead of recognizing those predefined shapes such as triangles, quadrilaterals, pentagons, etc, we are aiming to expand the recognition to any shape, those shapes without names. This April, we completed the first prototype of the software on Rhino. Now it can recognize any embedded shape in a bigger shape. However, users may want more, for instance, two L shapes can be arranged in multiple (infinite) ways, but they may just want one specific way. Thus, to approximately position the shape relationships, we introduce the concept of construction lines to provide users more precise recognition. Here is a demo video link:


Fig.01 - Implementation of Construction Line option

Video.01 - Demo of Construction Line in ARGO

2017年4月21日 星期五

CourtSpace | Update

Project Updates |

To improve the previous version of CourtSpace, we looked into the grammars of the federal courthouse in Austin to make CourtSpace more robust, practical and real.
Fig.01 - Grammars of Austin Courthouse
Fig.02 - Scheme of Austin Courthouse
Fig.03 - Alternative of Austin Courthouse
Fig.04 - "Two" Austin Courthouse
Fig.05 - Alternative of Austin Courthouse
Fig.06 - "Three" Austin Courthouse
Fig.07 - Alternative of Austin Courthouse 
Fig.08 - "Ring" of Austin Courthouse

Smart 3D Atlantta

Project Description | Smart 3D Atlanta

Smart 3D Atalanta is a project aimed to create a 3D model platform for urban researchers to develop applications with city data. In this project, we choose City of Atlanta as the first implementation. The city model of Atlanta is imported into the Cesium geographic platform which is an open-source platform developed on Bing map. Each building in City of Atlanta is loaded into the platform individually as an entity. Thus, the data visualization can happen in building scale for users' further applications. The data used in this test is directly from Google Place API, MARTA, City of Atlanta and other data providers.

Smart 3D Atlanta now is available on the web sever of DBL (Digital Building Lab), School of Architecture, Georgia Tech. Here is the link:

https://dcom.arch.gatech.edu/kurthello/apps/atlanta/index.html
Fig.01 - Screen shot of Smart 3D Atlanta (Radius coloring)
In this web service, the building will be highlighted when user moves cursor on the building. When user clicks on the building, the information (picture, address and name) from Google Place API will be shown in a info box. Also, there is a menu on the left hand side for user to switch to different color mode (data), show/hide the buildings, buses and stops.
Fig.02 - Screen shot of Smart 3D Atlanta (Heatmap)
In the implementation, the data of bus routes are from MARTA real-timely and each bus has its information. If the bus is late, it turns to red. In other words, users can monitor MARTA buses real-timely. The screen shot below shows the implementation.
Fig.03 - Screen shot of Smart 3D Atlanta (buses)
In this 3D city model, each bus stop can be shown/hidden. The buses and stops are also can be highlighted when users move mouse on them, and click it for more details.
Fig.04 - Screen shot of Smart 3D Atlanta (bus stops)
Fig.05 - Screen shot of Smart 3D Atlanta (building information)

2017年4月12日 星期三

Small 4-wall Architectures

Project Description |

Small 4-wall architecture is a conceptual project inspired by Louis I. Kahn. In Louis I. Kahn's plans, the simple geometries such as squares, triangles, rectangles are composed as a geometric context. And, some lines are eliminated and some lines are kept to create openings, circulations and spaces. This project is aimed to explore the compositions of 4 lines by using ARGO. In each plan shown here, there are 4 lines with various compositions, for example, one L-shape (2 lines) plus one Cross-shape (2 lines), one T-shape (2 lines) plus two floating lines, or 4 floating lines.


Fig.01 - Louis I. Kahn, Dominican Sisters’ Convent, First Floor Plan, Media, Pennsylvania, 1965-1968

4-line figures and 4-wall architectures |


To explore the possibilities of 4-line compositions, ARGO is used in this test. In the beginning, some simple geometries are placed together to form the context. Then, the user can draw any 4-line shape and input the shape to ARGO and it will list out all the isomorphic results. Some compositions have a lot of topological results (more than 1900), some compositions only have less than 8 topological results. By selecting some interesting results and thickening the lines to form the walls, small architectures with 4 walls are presented.


Fig.02 Compositions of L-shape and T-shape (Context: Two Squares, One Triangle)
Fig.03 Compositions of X-shape and T-shape (Context: Two Squares, One Triangle)
Fig.04 Compositions of J-shape (Context: Two Squares, One Triangle)
Fig.05 Compositions of C-shape/Z-shape and One floating line (Context: Two Squares, One Triangle)
 Fig.06 - Compositions of L-shape and T-shape (Context: Two Triangles)
  Fig.07 - Compositions of L-shape and two floating lines (Context: Two Triangles)
  Fig.08 - Compositions of 4 floating lines (Context: One Triangle and One Square)
  Fig.09 - Compositions of two L-shapes (Context: Two Squares)
 Fig.10 - Compositions of L-shape and T-shape (Context: Two Squares)


 Fig.11 - All compositions of L-shape and T-shape (Context: Two Squares)
Fig.12 - Small 4-wall Architecture example


2017年3月8日 星期三

Shape Theory | Shape Grammar and Shape Recognization


Shape Grammar and Shape Recognization |

As a shape grammar researcher, there is always a question for you: What is shape grammar for? In fact, for me, shape grammar is similar to number theory in math. In number theory, for instance, there is a famous research field about partitioning. Number "5" can be presented as 2+3, 1+1+1+2, 4+1, etc.There are multiple ways to partition a number 5 with integers. If the number is larger, then the partition ways will be dramatically increasing. However, the focus of this article is not on numbers, it's on shapes. In those current architectural CAD tools such as AutoCAD, Rhinoceros, SketchUp, Revit or other tools, the geometry description method is very efficient but poor. For example, when we draw two squares such as the figure shown below:

常有人問我一個問題,形狀文法到底是幹嘛的? 其實形狀文法對我來說就像數論一樣,比方說數論中Partition的問題,5可以被拆解成1+4或是2+2+1或是2+3等等,這些比5還小的數字隱藏在5當中,透過組合可以產生5這個數值,5的拆解方法很多,隨著數字越來越大,拆解方法會急速增加。但這篇文章的重點不在於數論,而是形狀。在目前主流的設計軟體中,比方說AutoCAD,Rhinoceros,Revit,SketchUp或是其它軟體,幾何的描述方式是頗有效率的,但不可否認的是當前描述形狀的方式卻也是相當貧乏的。舉個例子來說,當我們在Rhino中畫兩個正方形如下圖:


In computer system, this shape will be documented as two objects (big square and small square). To a computer, it can't see other things except these two squares, it can't see "emergence shapes". In this shape, there are many emergence shapes, like 4 triangles, 12 pentagons, 2 hexagons, etc. These emergence shapes are not drawn by us, they "pop-up" after we draw two squares. In other words, a shape actually can be documented (described) in more ways. However, the current CAD tools can't recognize the emergence shapes, thereby limiting the abilities of designers' eyes and brains. For example, the current CAD tools can only partition 5 into 2+3 or 3+2, they can't decompose a shape into different shapes. This is the nature of current CAD tools, but the engineers didn't notice this point when they were developing these CAD tools. Geometries are represented (or described, documented) in "valid and economical" ways only. Thus, this geometry description system sets up a huge limitation on creativity.

在系統裡面,這個形狀會被記錄為兩個物件(一大一小的正方形),對於電腦來說,除了這兩個正方形之外,它看不到其它任何東西,或是我們所謂的"衍生出來的形狀 (Emergence Shape)",在這個形狀裡頭,衍生形狀非常多,比方說有四個三角形,十二個五邊形,兩個六角形等等。這些衍生形狀並非我們特意去畫出來的,而是在我們畫完兩個正方形之後自己產生出來的。反過來說,這個形狀其實可以用更多方式被描述,但目前的軟體並無法做到這一點,簡單來說,使用這類軟體的時候事實上是大大限制了我們的眼睛與大腦。當前的軟體扼殺了許多可能性,只因為它"看不見"這些衍生出來的形狀,或是,它無法用其它方式來拆解這個形狀。打個比方,對於軟體來說。5只能被拆解成3+2,並沒有辦法被拆解成其它的組合,這是幾何描述系統的根本,但當初我們在設計軟體的時候只求"有效並經濟"地重現(或記錄,或描述)幾何,於是這些繪圖軟體便成了創造力的限制。


In fact, this concept is the core of shape grammar. Lionel March, George Stiny and William Mitchell have proposed this idea 50 years ago. However, CAD tools were still rudimentary, computer technologies were still naive, so we keep ignoring this concept while we making CAD tools. Therefore, ARGO is the project which is aimed to define a more general geometry description system, thereby opening more possibilities for designers. For now, ARGO can recognize all 6-line shapes, these shapes can be not only one single closed shape but also a collection of multiple shapes such as a triangle with a floating line, the test result is shown in the table below.

事實上,這個概念是形狀文法的核心,Lionel March,Bill Mitchell跟George Stiny在五十多年前就提出這個概念,但當初電腦輔助軟體尚未成熟,科技面也無力去探討這個問題,我們不斷地忽略這個限制。因此我們正在開發的ARGO幾何編譯引擎的目標就是能夠讓目前的CAD軟體能夠有更通用(Generalized)的幾何描述方式,藉此打開長久以來CAD的限制。目前ARGO能夠找出所有6條線之內的圖形,並不受限於封閉形狀或是單一形 (可以是一個三角形加上一個L形),基本上目前的測試範圍是所有六條線之內的任意形。


If CAD tools can recognize more sub-shapes just as our eyes and brains (even better than that), shape computations can be more flexible, free and ample. For instance, the two-square shape can be decomposed into more combinations:

假如軟體能夠辯識出更多的子形 (如我們的眼睛大腦一般,或是更好),那麼形狀的運算就可以更豐富。比方說上述兩個正方形的形狀就可以被拆解成許多可能的組合:

Shape = Square + Square
Shape = Triangle + Triangle + Triangle + Triangle
Shape = K-shape + K-shape + Line + Line

形狀 = 正方形 + 正方形
形狀 = 三角形 + 三角形 + 三角形 + 三角形
形狀 = K形 + K形 + 直線 + 直線
.
.
.

Such decomposing methods can be infinite if we don't limit the elements as "boundary line" (the line with clear boundary, the boundary of lines are vertexes) such as 5 can be decomposed into 2.5+1+1.5. Hence, the two-square shape can also be decomposed as the combination of 4 K-shapes with 4 L-shapes shown as below.

諸如此類的拆解法,可以是無窮多種的,如果我們不侷限於邊界線段(Boundary line)的話,就如同5也可以拆解為2.5+1+1.5,如果不限於整數的話,5的拆解法也是無窮多的。比方說上述的形狀也可以被拆解成四個K形加上四個L形,如下圖


Nevertheless, ARGO cannot achieve this type of decomposition, it can only do the decomposition with boundary lines. Even though ARGO can't achieve infinite decomposition, ARGO still can help us improve current CAD tools.

目前ARGO尚無法做到此類的拆解,只能做到邊界線段的拆解。但邊界線段拆解有個好處就是邊界線段可以被視為形狀的基本元素 (Primitive),尚不討論曲線的話,所有的形狀都可以被邊界線段組合出來,也是George Stiny在Shape一書當中的清楚定義。即便ARGO還無法做到非邊界線段拆解,但對於當前的CAD軟體也是有相當大的幫助。


2017年2月24日 星期五

Hello Atlanta !

Project Description | Hello Colorful Atlanta! Data visualization on Cesium platform!

The goal of this project is to research how smart a city can be, and how we can design a city in a smart way. In this project, we use Atlanta as the research subject. Atlanta is a city which has a convenient public transportation system, MARTA. As a busy public transportation system, MARTA is able to collect massive data by installing sensors on the trains, bus and stations. The data collected can be used to develop some applications and make this city respond to people's needs more quickly, or, real-timely. Hence, this project is aimed to input MARTA data to architecture design, urban design to develop a system for Atlanta citizens. The first take we did is to visualize the MARTA data in building scale.

Fig. 00. Heat Map of ATL - Dennis R. Shelden, Diego Osorio, T.C. Kurt Hong, 2017 Spring

Fig. 01. Real Time Updating Transportation - Dennis R. Shelden, Diego Osorio, T.C. Kurt Hong, 2017 Spring

Fig. 02. Data Visualization of ATL - T.C. Kurt Hong, 2017 Spring

Fig. 03. Data Visualization of ATL - T.C. Kurt Hong, 2017 Spring

Fig. 04. Data Visualization of ATL - T.C. Kurt Hong, 2017 Spring

Fig. 05. Coloring Test of ATL - T.C. Kurt Hong, 2017 Spring